Doing stuff with data
A PERSONAL SPACE TO SHARE MY PASSION AND KEEP LEARNING
Data
I’m an experienced data analyst, turning messy raw data into insight. I enjoy working with all kinds of data — quant and qual, big and small.
My main tool for data collection, cleaning and analysis is python, often in combination with SQL and Excel. I’m always keen to learn about new data science methods.
Insights
Throughout my professional life I have used data to help inform policy making, strategic decisions and product development.
I like to communicate about research and translate technical language into simple and engaging messages. My outputs are clear, concise and relevant to the main research questions.
Visualisations
I’ve always been interested in art and graphic design. In the past I have been drawing a lot and I know how to use Indesign, Illustrator and Photoshop.
To display data I use a range of charting libraries (plotly, highcharts, matplotlib) and other charting tools (datawrapper, tableau). One of my goals is to learn D3 for interactive visualisations.
Recent projects
Latest articles
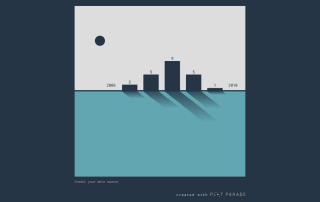
Six things I learned by tracking my plastic waste everyday in 2021
In 2021, I was tired of not being able to do a single shopping without plastic. So I tracked our plastic waste for an entire year to better understand and reduce our footprint. This is what I learned [...]
The best free tools for data viz and data for good
A few months ago I started sharing #ThursdayTools with my team and these might be useful for others too. So here are my top open source, non-code tools for data viz, data for good, charity data, maps, infographics and more [...]

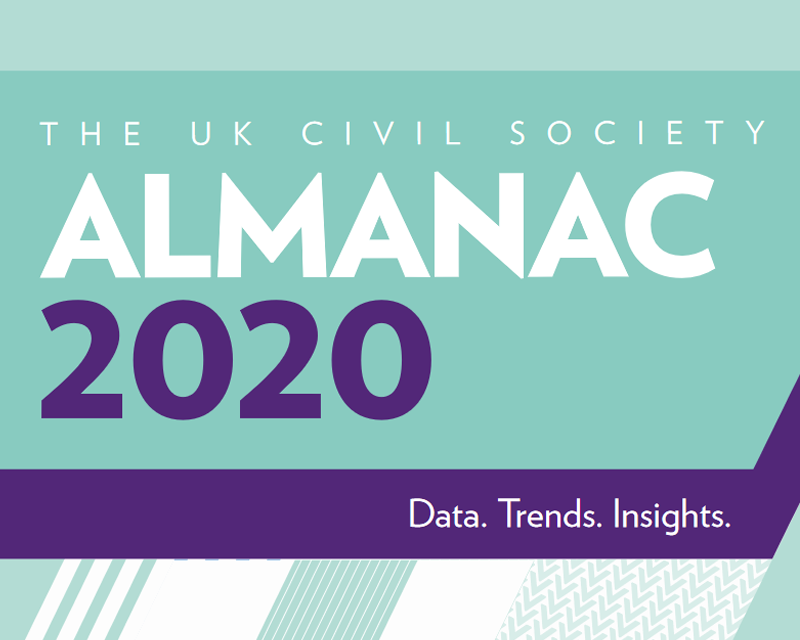
Where to get data on charities in the UK
When the pandemic hit and the charity sector struggled to predict its impact, it highlighted the need for better data. But what data does exist? And how do you get it? This blog outlines some of the most important data sources for anyone with an interest in the UK charity sector.
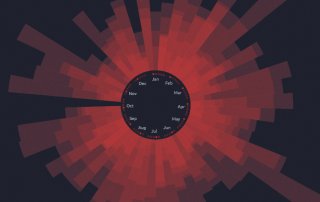
Kneading to relax: exploring lockdown baking trends
With millions confined to their homes, bread making started trending in 2020. Analysing data from Reddit reveals some interesting facts about the sourdough community [...]
Six things I learned by tracking my plastic waste everyday in 2021
In 2021, I was tired of not being able to do a single shopping without plastic. So I tracked our plastic waste for an entire year to better understand and reduce our footprint. This is what I learned [...]
The best free tools for data viz and data for good
A few months ago I started sharing #ThursdayTools with my team and these might be useful for others too. So here are my top open source, non-code tools for data viz, data for good, charity data, maps, infographics and more [...]
Where to get data on charities in the UK
When the pandemic hit and the charity sector struggled to predict its impact, it highlighted the need for better data. But what data does exist? And how do you get it? This blog outlines some of the most important data sources for anyone with an interest in the UK charity sector.