Blog /
Six things I learned by tracking my plastic waste everyday in 2021
28 June | 4 min read
In 2020, I became tired of not being able to do a single shopping trip without buying and consuming plastic. So I decided to track our plastic waste for a whole year and see how much plastic we (my partner and I) were actually consuming. Luckily, I found MyPlasticDiary to help me record plastic use everyday. For each item you select a category and then record its weight. The app allows you to track your consumption against a weekly target and also gives scores (a combination of item type and weight). Six months into 2022, I finally managed to analyse my data and write up what I learned.
1. Tracking plastic everyday is hard
Recording plastic everyday for an entire year was very time consuming. Even though MyPlasticDiary includes preset categories and gives you approximate weights, I often weighed items on our kitchen scale and put in the exact measure (why wouldn’t you?). Some days I forgot to record items and included them the next day. I also didn’t record while away on holidays. So, gaps in our data didn’t necessarily mean that we didn’t consume any plastic that day.
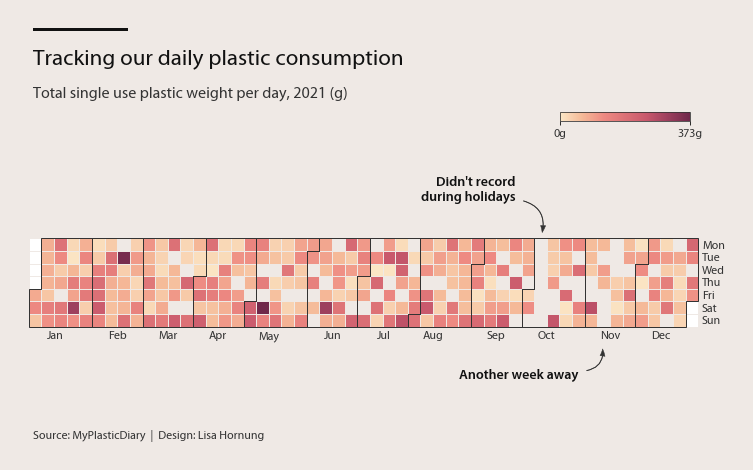
2. I had no idea how much plastic I am consuming
I always knew that we were consuming too much plastic, but I had no idea what that meant in terms of numbers. In 2021, we threw away 2,556 plastic items, totalling 32kg or 16kg per person. To put this into perspective, this would be about 1,066 yoghurt pots (a 500ml yoghurt pot weighs around 15g). While these figures look big, they are an underestimate of the real number since I didn’t record absolutely everything.
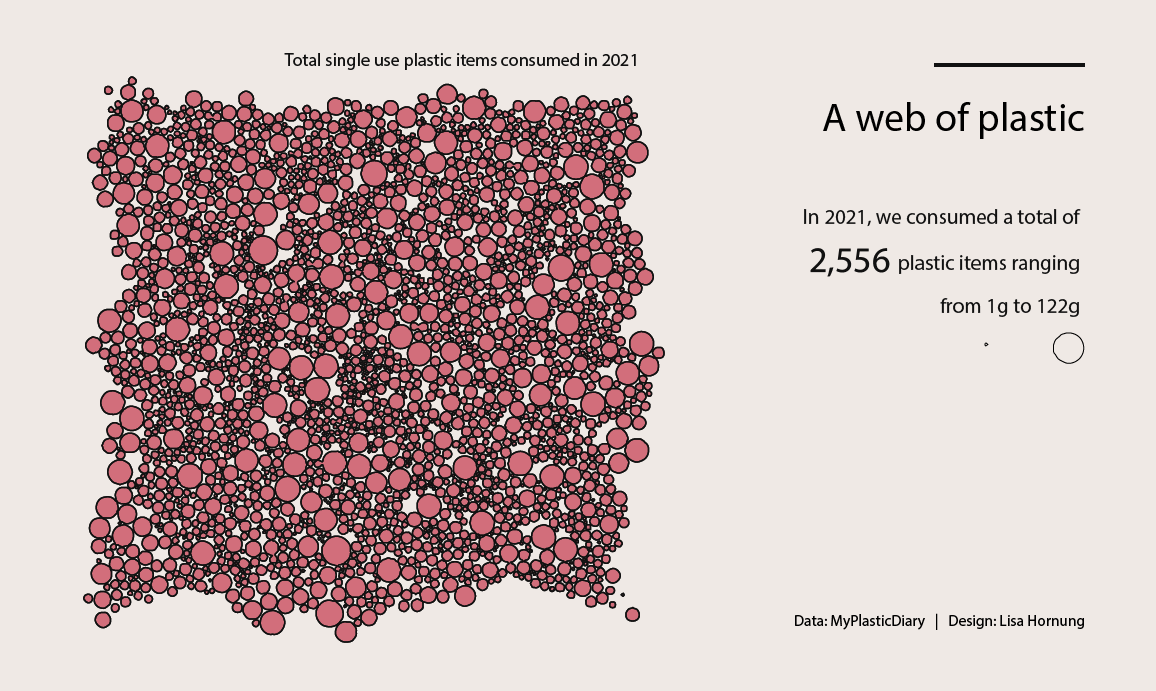
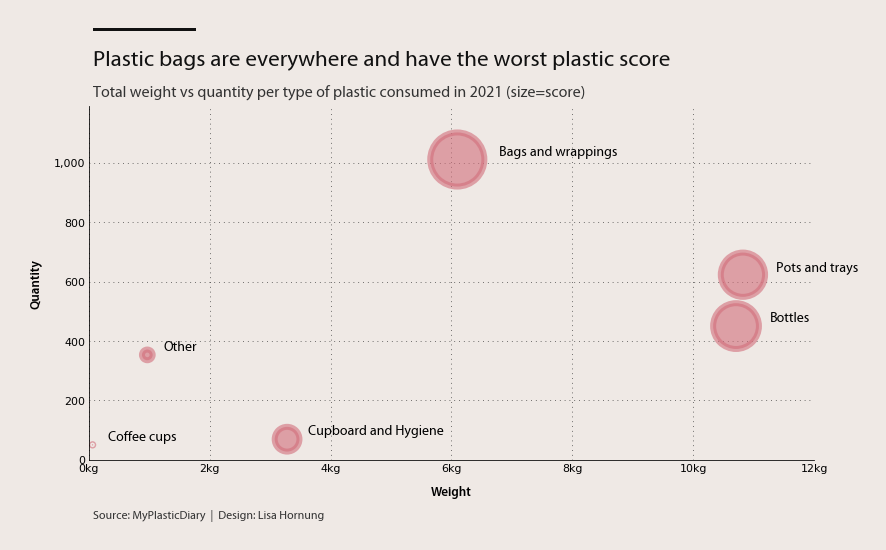
3. Pots and bottles were the biggest contributors of total weight but produce bags made up the largest proportion of items
Using predefined categories in MyPlasticDiary, I could look at our plastic consumption by types of products. Unsurprisingly, bottles and pots/trays made up the biggest amount in terms of weight, but bags and wrappings accounted for 40% of all items we threw away. And I could even look at subcategories, for example we threw away 251 Tetra paks, 78 yoghurt pots, 60 carrier bags and 39 shampoo bottles.
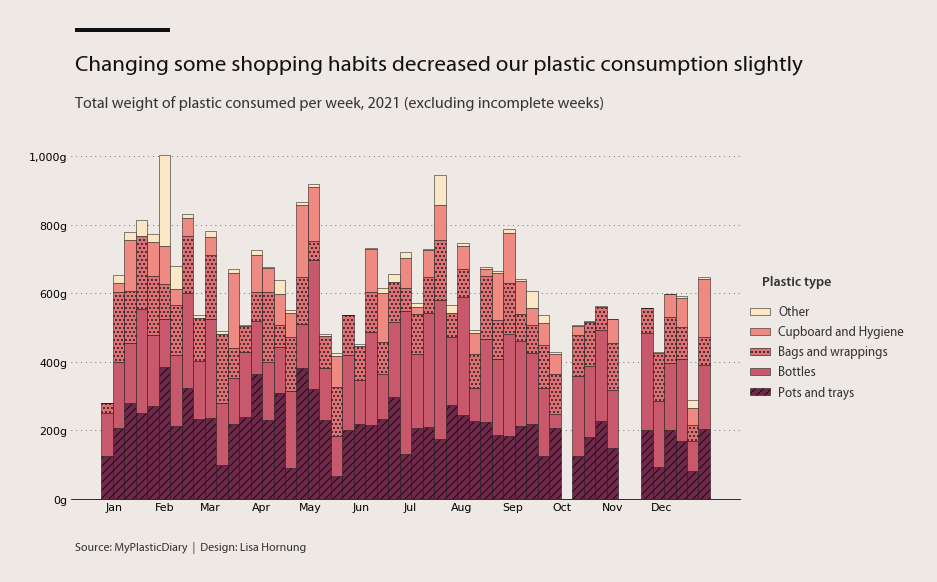
4. Changing small shopping habits decreased our plastic consumption, but only slightly
I didn’t just want to track our plastic consumption but also reduce it. Some things we changed (or at least tried):
- Stop grocery delivery to have more control over our shopping
- Use cotton bags for loose vegetables
- Buy larger package sizes for things like yoghurt, bottled water, rice, pasta
- Use reusable coffee cups again (shops didn’t accept them at the height of the pandemic)
We’re still buying some bottled water but also use a water filter for tap water. We didn’t want to start spending significantly more money, eg. in special shops that don’t use plastic. So in the end our plastic consumption decreased only slightly, even though we were even more aware of our shopping behaviours.
5. Some things were really difficult or impossible to track
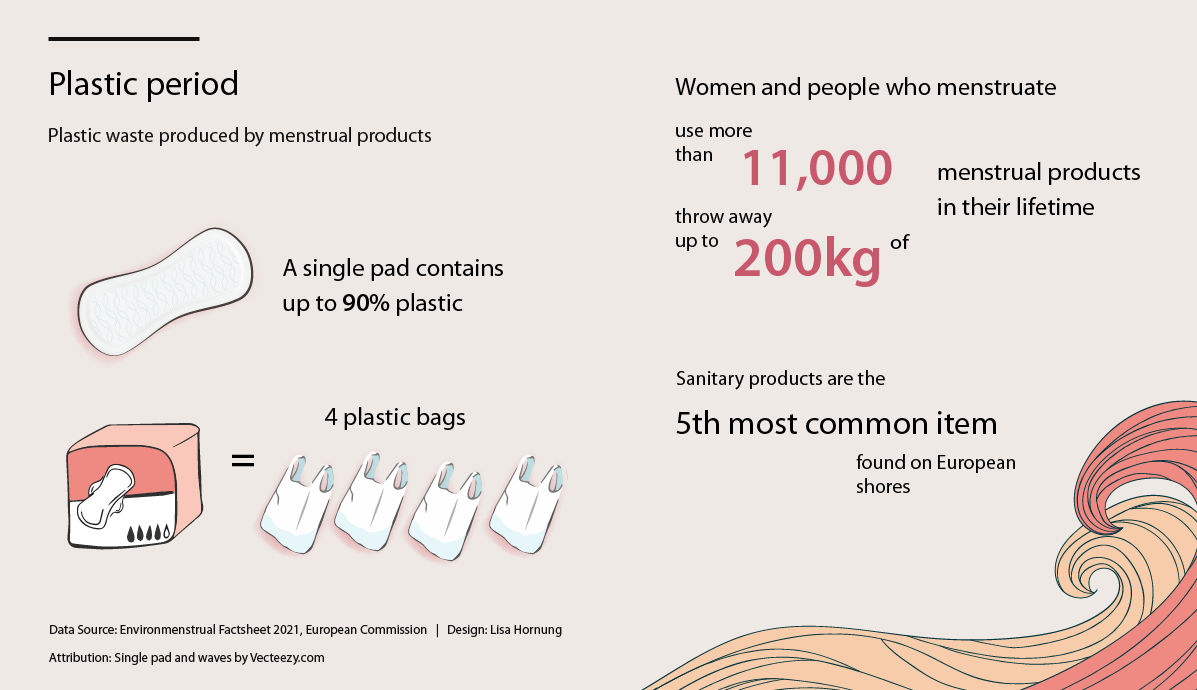
While I tried to record our plastic waste as best as possible, it is still an underestimate of our actual consumption. It is missing things we forgot to track, plastic we consumed when being out and about or plastic we didn’t know was plastic (eg. in clothes). For example, I often forgot to record bin bags themselves (each bin bag weighs around 7g). Our data also excludes items where it was unclear how much plastic they are made of, eg. crisps bags which look like foil but actually contain metallised plastic film. Another thing I didn’t track consistently were menstrual products. But recording parts of it made me finally switch to using a menstrual cup.
6. There isn’t a consistent standard to compare my data against
It isn’t just hard to consistently track your own plastic consumption, but also to find data to compare yourself against. First of all, there are different ways of looking at it. Most sources either focus on single-use plastic waste while some studies have tried to estimate the total plastic waste per person, including single-use plastic as well as waste from businesses, industry and agriculture. Considering that some of our data is missing, it’s not surprising that our consumption is below both the EU (31kg) and UK (44kg) average for single use plastic waste per person. The latest estimate on total plastic waste claims that the average person in the UK produces 99kg of plastic per year.
We need policies and system change to tackle plastic pollution
Plastic is destroying our nature, wildlife and human health. If we really want to tackle plastic pollution, we need a system change, better data and stricter policies.
I still can’t believe that companies aren’t obligated to publish details about their packaging, which would make it easier to get this kind of data. While you can scan barcodes to get calorie information, the same doesn’t yet exist for plastic because we simply don’t know enough about plastic in packaging (how much, recycled or not, what type, etc.). MyPlasticDiary is currently developing a service to help retailers show information about plastic packaging online.
Consumers alone can’t be responsible for solving the plastic crisis. We need reforms that encourage recycling on a large scale and also acknowledge the role of corporate polluters. More importance should be placed on alternative packaging solutions and ban single use plastic beyond plastic straws. If you want to read more on this topic, check out this article: More recycling won’t solve the plastic pollution – it’s a lie that wasteful consumers cause the problem and that changing our individual habits can fix it.
The geeky part
Most of the analysis is based on my own plastic use data tracked using MyPlasticDiary. The app itself gives you some plastic use stats to see if you are on track against the goals you set. At the moment you can’t export data, but the team behind the app was super helpful in sharing a csv file with me when I got in touch. Data for plastic in period products was sourced from wen and the European Commission.
There was no need for extensive data cleaning and I made only small adjustments. I changed the weight recorded for Tetra Paks to 20% of their full weight, as this article suggests 14% of Tetra Paks are plastic sheets and 6% bioplastic caps. As I only started recording on the 6th of January 2021, I used data from January 2022 for those first few missing days.
Analysis was done in python as well as most of the visualisations using matplotlib and calplot. All my code can be found on Github.