
How to create storyboards for your product vision using generative AI
Storyboards hold great value for product design. This is how I used Midjourney to create a storyboard to support our product vision and roadmap.
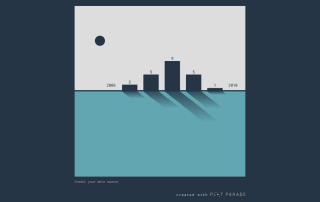
Six things I learned by tracking my plastic waste everyday in 2021
In 2021, I was tired of not being able to do a single shopping without plastic. So I tracked our plastic waste for an entire year to better understand and reduce our footprint. This is what I learned [...]
The best free tools for data viz and data for good
A few months ago I started sharing #ThursdayTools with my team and these might be useful for others too. So here are my top open source, non-code tools for data viz, data for good, charity data, maps, infographics and more [...]

Where to get data on charities in the UK
When the pandemic hit and the charity sector struggled to predict its impact, it highlighted the need for better data. But what data does exist? And how do you get it? This blog outlines some of the most important data sources for anyone with an interest in the UK charity sector.
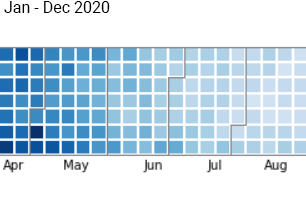
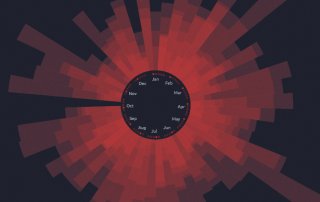
Kneading to relax: exploring lockdown baking trends
With millions confined to their homes, bread making started trending in 2020. Analysing data from Reddit reveals some interesting facts about the sourdough community [...]
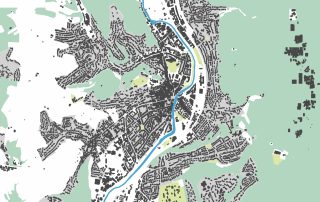
Exploring QGIS for visualising maps
I recently left my old job and my team gave me an amazing book with 100 maps of London. Feeling inspired, I wanted to explore some mapping tools for geospatial data. This blog shows some of my experiments using QGIS, an extensive open source desktop software. [...]
How to create storyboards for your product vision using generative AI
Storyboards hold great value for product design. This is how I used Midjourney to create a storyboard to support our product vision and roadmap.
Six things I learned by tracking my plastic waste everyday in 2021
In 2021, I was tired of not being able to do a single shopping without plastic. So I tracked our plastic waste for an entire year to better understand and reduce our footprint. This is what I learned [...]
The best free tools for data viz and data for good
A few months ago I started sharing #ThursdayTools with my team and these might be useful for others too. So here are my top open source, non-code tools for data viz, data for good, charity data, maps, infographics and more [...]
Where to get data on charities in the UK
When the pandemic hit and the charity sector struggled to predict its impact, it highlighted the need for better data. But what data does exist? And how do you get it? This blog outlines some of the most important data sources for anyone with an interest in the UK charity sector.
Kneading to relax: exploring lockdown baking trends
With millions confined to their homes, bread making started trending in 2020. Analysing data from Reddit reveals some interesting facts about the sourdough community [...]
Exploring QGIS for visualising maps
I recently left my old job and my team gave me an amazing book with 100 maps of London. Feeling inspired, I wanted to explore some mapping tools for geospatial data. This blog shows some of my experiments using QGIS, an extensive open source desktop software. [...]