Selection of work
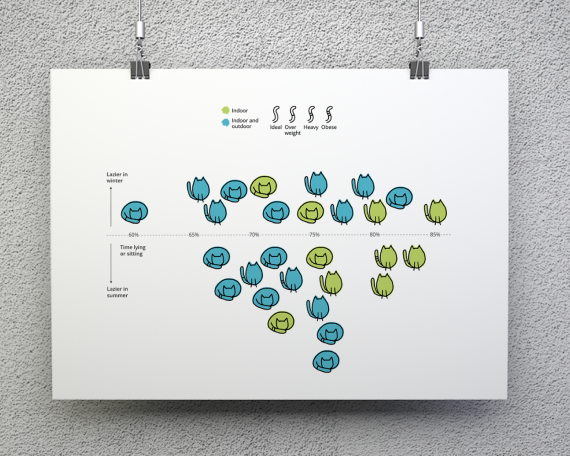
Lazy cats
Visual data story exploring cat behaviour across seasons
Data viz design system
Refreshed styles for Health Foundation data visualisation content

100 Days of data viz
Personal project to create 100 data visualisations to keep experimenting and try new tools

Traffic data dashboard
Data visualisation and product design for the VivaCity traffic data dashboard and API

Year in sports
Web application to create a visualisation of all my Strava activities in a year

30 Day Map Challenge 2023
Contributions to the #30DayMapChallenge experimenting with new ways to visualise geospatial data

Search roulette
Web application visualising Google Search autocompletes for any prompt

My year in plastic
Personal project tracking and visualising my plastic waste over one year

Grantmaking in Yorkshire & Humber
Dashboard and research report on charitable grant funding in the Yorkshire & Humber region

UK Civil Society Almanac
Annual research report and other visual outputs on the UK charity sector
Lazy cats
Visual data story exploring cat behaviour across seasons
Data viz design system
Refreshed styles for Health Foundation data visualisation content
100 Days of data viz
Personal project to create 100 data visualisations to keep experimenting and try new tools
Traffic data dashboard
Data visualisation and product design for the VivaCity traffic data dashboard and API
Year in sports
Web application to create a visualisation of all my Strava activities in a year
30 Day Map Challenge 2023
Contributions to the #30DayMapChallenge experimenting with new ways to visualise geospatial data
Search roulette
Web application visualising Google Search autocompletes for any prompt
My year in plastic
Personal project tracking and visualising my plastic waste over one year
Grantmaking in Yorkshire & Humber
Dashboard and research report on charitable grant funding in the Yorkshire & Humber region
UK Civil Society Almanac
Annual research report and other visual outputs on the UK charity sector